
![]()
Enterprise Integrated Emissions Management Software
Driving better operations and workflows through strategic emissions management.
Connect data streams, operational activities, and program performance.
With all relevant data at your fingertips, AroViz enables you to strategically and economically abate methane emissions by supporting operational and environmental workflows.

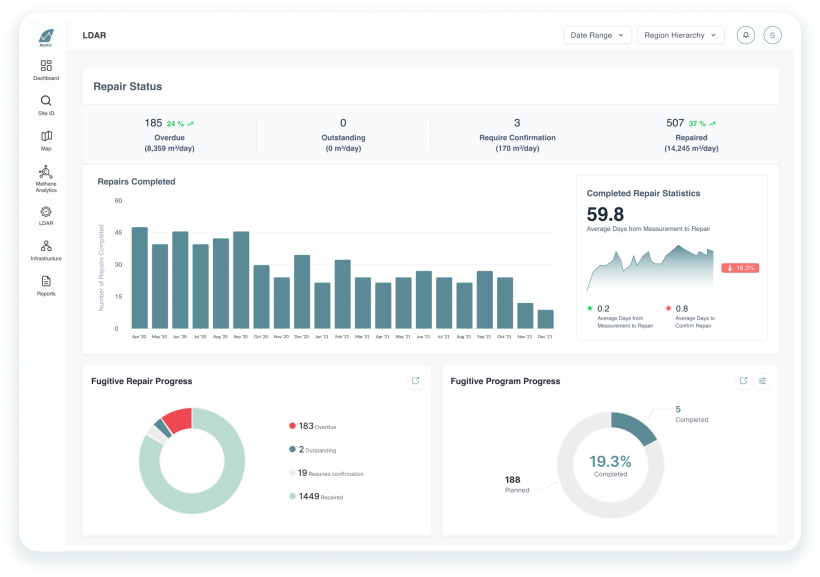
LDAR Workflow & Reporting (+ Field App)
Arolytics simplifies emissions management by integrating measurement, operational, and asset data into one platform to support reporting and automated leak detection and repair workflows.
Our mobile field application is a user-friendly solution for reliable, remote field data collection.
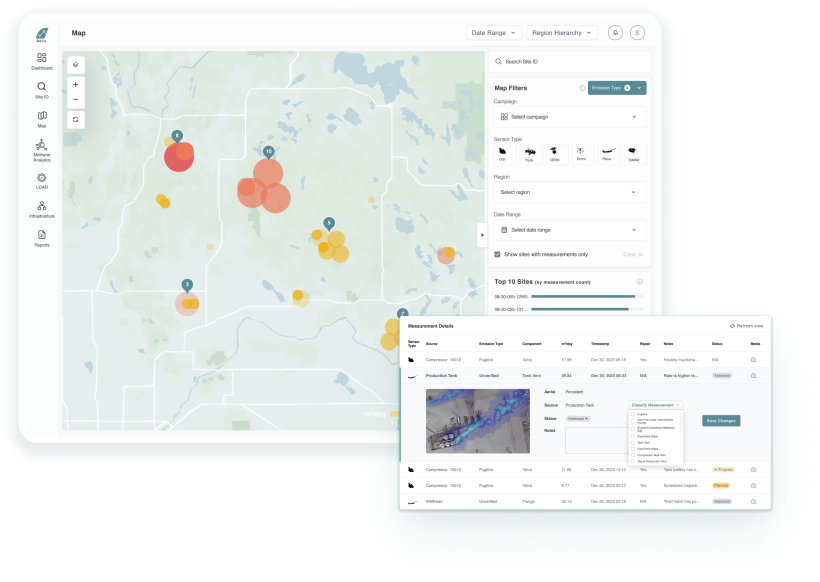

Methane Reduction Intelligence
Visualise top down and bottom up data all together in one spot, look at various media, Identify mitigation projects, track reductions for best ROI and build towards a measurement-informed inventory.
Our analytics help you understand sites such as top and repeat emitters in detail, enabling you to drill down to a site and reclassify emission events as needed.

Site Level Detailed View
Drill down to a specific site (ie. compressor station) to view all historic data, outstanding leaks and repairs, and understand your emissions (measured or reported) inventory. Re-classify emission events or equipment types, view progress on reductions, and keep detailed oversight and assign actions.

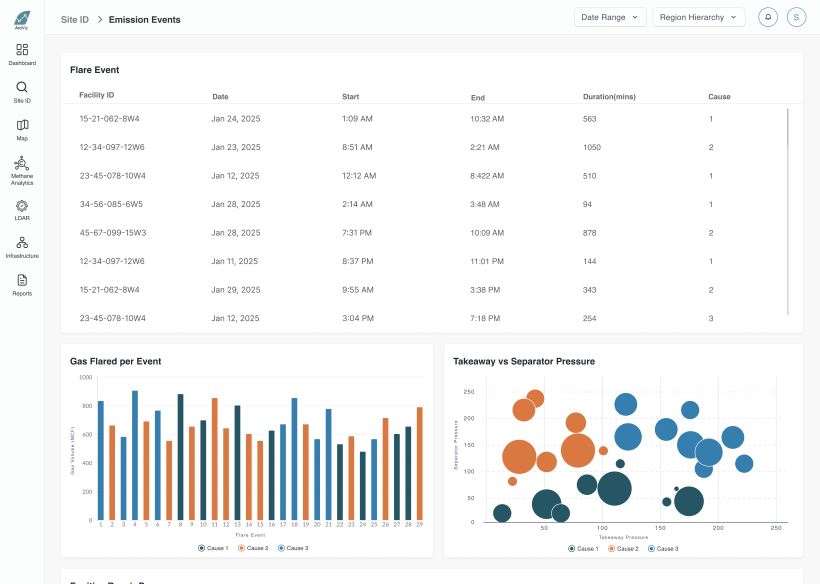

Desktop Review: Emission Event Response
Reduce your carbon liability by better understanding key emission sources.
Understand emission duration and causation of events, complete an organized desktop review, and optimize field responses for events such as unlit pilot flares, tank thief hatches, and more.
Key Value Adds
We've been in your shoes
Our team is comprised of engineers, data scientists, and industry experts, many of which have been in your shoes. We relate and understand your priorities and goals.
Sensor agnostic
Our technology agnostic approach enables us to scale as you do, whether you are brining on new measurement sensors or have recently gone through an acquisition.
Ongoing support
Our emissions analysts work hand in hand with you before, during, and after deployment the software, ensuring your needs are supported.
FAQs
Our software is sold via a subscription model, priced according to the number of sites that are being managed within the platform. Contact us to learn about discounted pilot opportunities.
Our users range from field personnel who are accountable for tracking and fixing repairs, to regulatory managers or air quality specialists who oversee their company's compliance program, to executives who need broad oversight and KPIs around emissions performance. We have the ability to provide different levels of permissions to different users, ensuring you get out of the platform what you need.
No. Arolytics is a software and advisory company. This enables us to be uniquely positioned to support our clients with measurement technology assessments and also enables us to take a flexible approach to data integration within our software.
Many ways! Ideally we will automate the data ingress with an API connection. Or, our team of emissions analysts can cover any bulk uploads of data into the platform.
As much as you need. All accounts get assigned a dedicated emissions analyst and customer success personnel who 's job revolves around ensuring you are getting the value you need out of the platform. They are expert resources you can rely on.